Observability Models#
The current production-stack uses a combination of Prometheus and Grafana to provide observability for the stack.
Deploy the observability stack#
The stack is based on kube-prom-stack.
To launch the observability stack you need
A running Kubernetes (K8s) environment with GPUs
Please follow the steps in the Minimal Example section.
After that you can run:
cd production-stack/observability
sudo bash install.sh
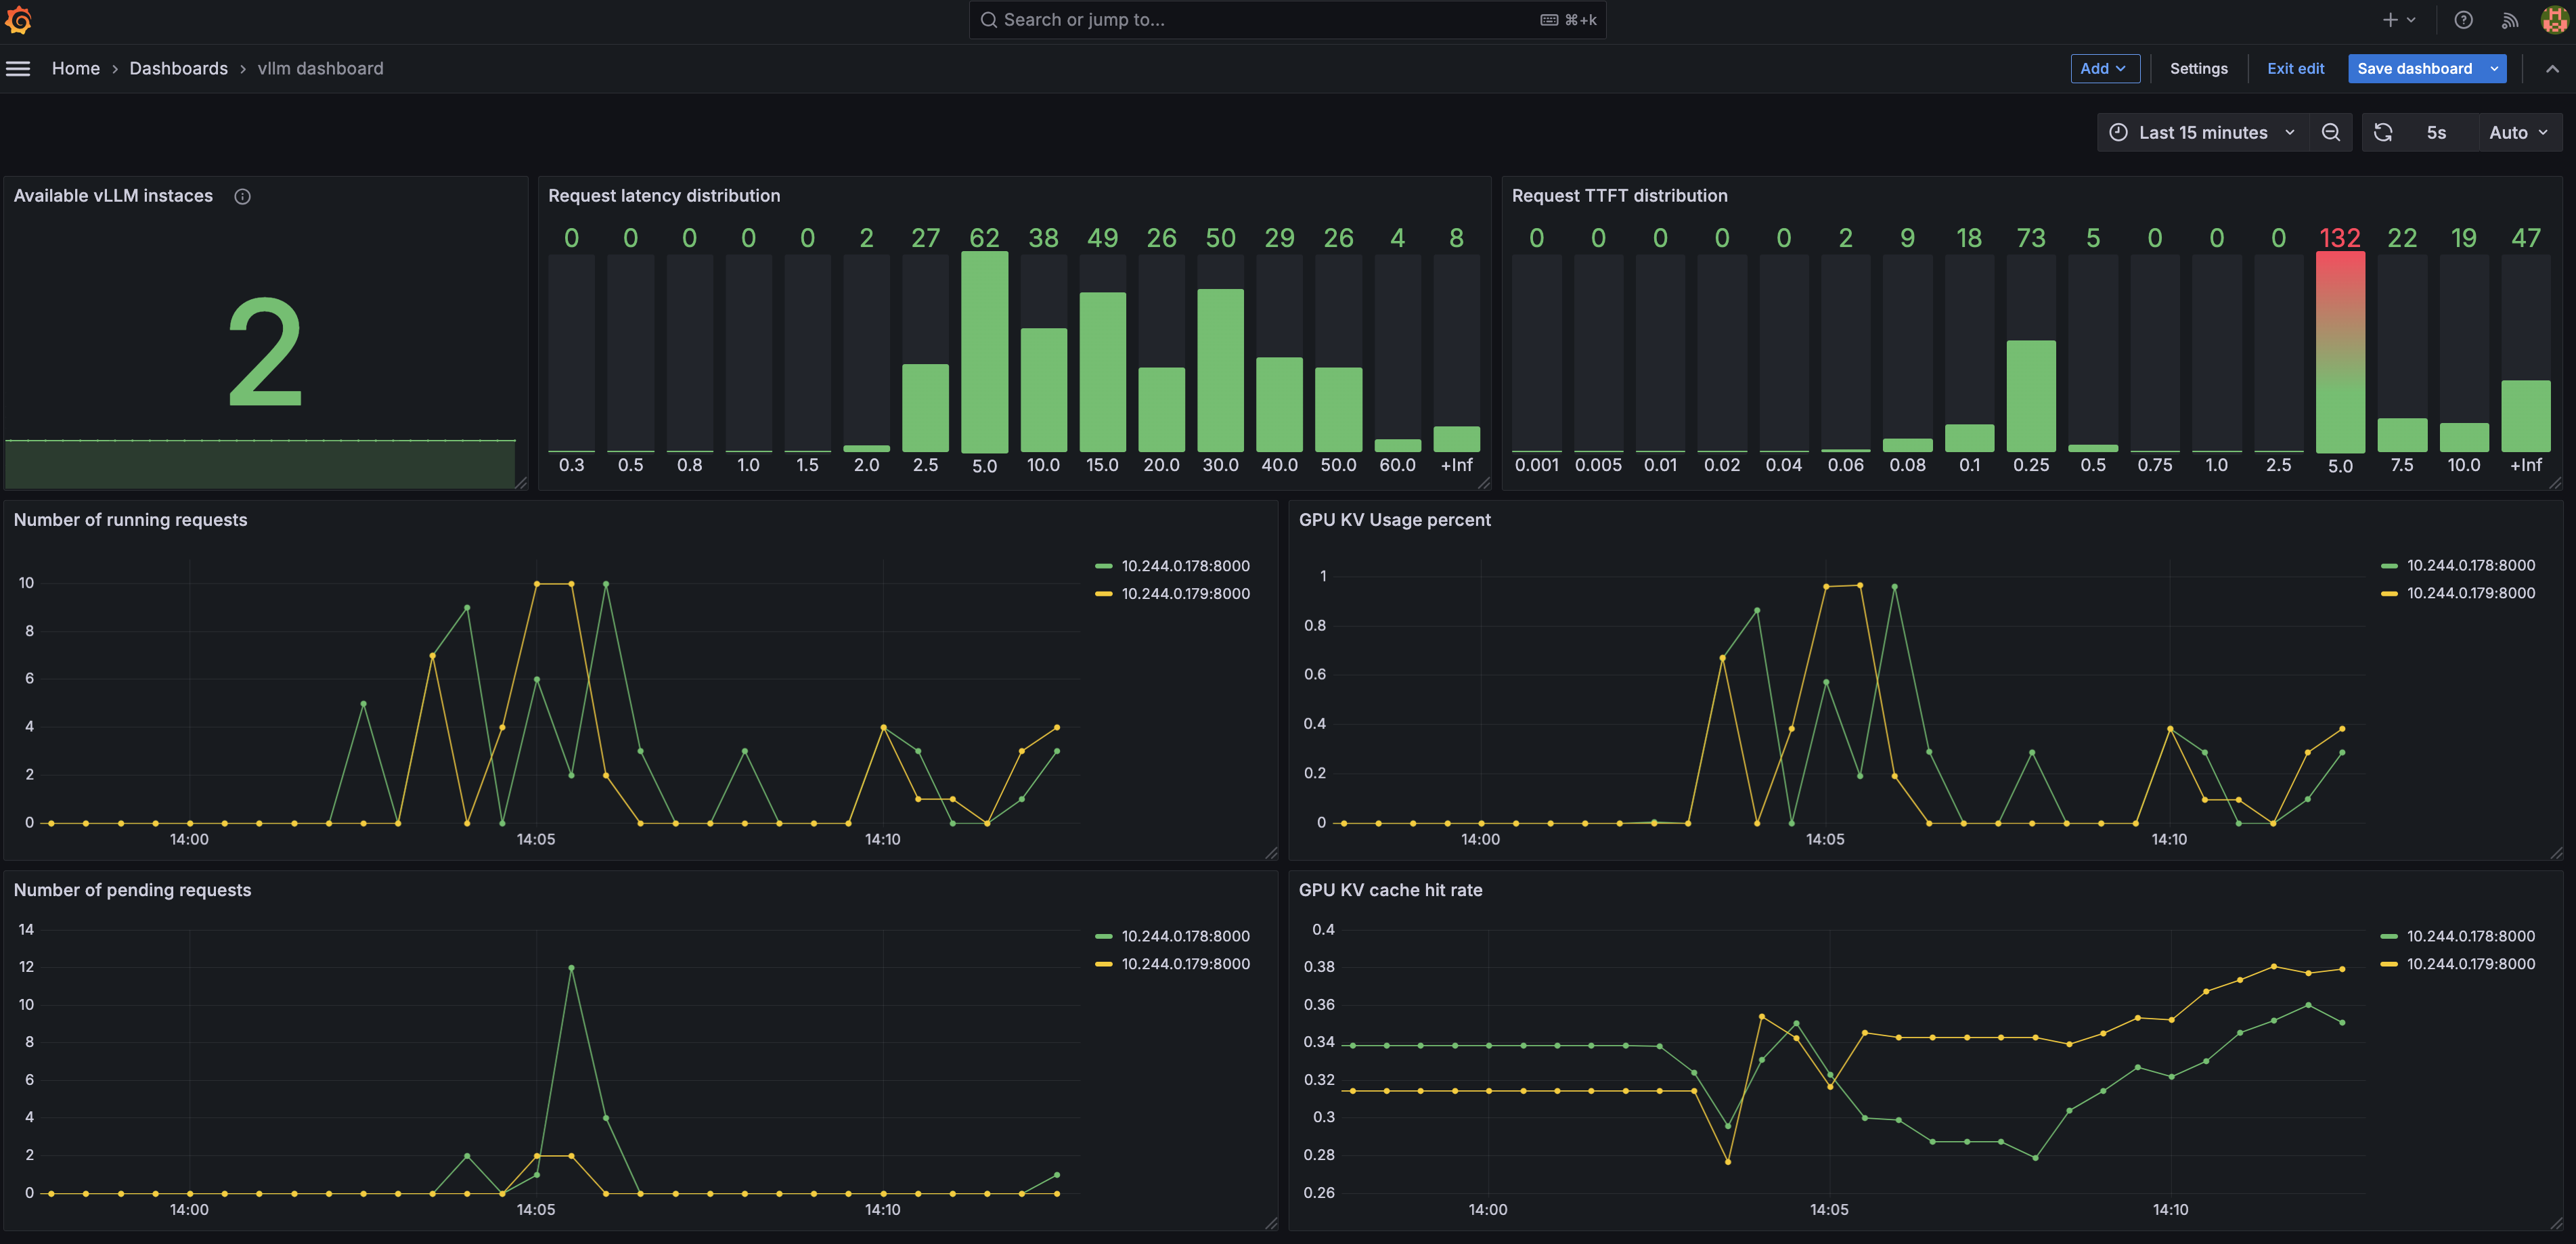
After installing, the dashboard can be accessed through the service service/kube-prom-stack-grafana in the monitoring namespace.
Access the Grafana & Prometheus dashboard#
To access the Grafana dashboard, you need to port-forward the Grafana service to your local machine.
Forward the Grafana dashboard port to the local node-port
sudo kubectl --namespace monitoring port-forward svc/kube-prom-stack-grafana 3000:80 --address 0.0.0.0
Forward the Prometheus dashboard
sudo kubectl --namespace monitoring port-forward prometheus-kube-prom-stack-kube-prome-prometheus-0 9090:9090
Open the webpage at http://<IP of your node>:3000 to access the Grafana web page. The default user name is admin and the password can be configured in values.yaml (default is prom-operator).
Import the dashboard using the vllm-dashboard.json in this folder.
Use Prometheus Adapter to export vLLM metrics#
The vLLM router can export metrics to Prometheus using the Prometheus Adapter. When running the install.sh script, the Prometheus Adapter will be installed and configured to export the vLLM metrics.
We provide a minimal example of how to use the Prometheus Adapter to export vLLM metrics. See prom-adapter.yaml for more details.
The exported metrics can be used for different purposes, such as horizontal scaling of the vLLM deployments.
To verify the metrics are being exported, you can use the following command:
kubectl get --raw /apis/custom.metrics.k8s.io/v1beta1/namespaces/default/metrics | jq | grep vllm_num_requests_waiting -C 10
You should see the following output:
{
  "name": "namespaces/vllm_num_requests_waiting",
  "singularName": "",
  "namespaced": false,
  "kind": "MetricValueList",
  "verbs": [
    "get"
  ]
}
The following command will show the current value of the metric:
kubectl get --raw /apis/custom.metrics.k8s.io/v1beta1/namespaces/default/metrics/vllm_num_requests_waiting | jq
You should see the following output:
{
    "kind": "MetricValueList",
    "apiVersion": "custom.metrics.k8s.io/v1beta1",
    "metadata": {},
    "items": [
        {
        "describedObject": {
            "kind": "Namespace",
            "name": "default",
            "apiVersion": "/v1"
        },
        "metricName": "vllm_num_requests_waiting",
        "timestamp": "2025-03-02T01:56:01Z",
        "value": "0",
        "selector": null
        }
    ]
}
Uninstall the observability stack#
To uninstall the observability stack, you can run:
cd production-stack/observability
sudo bash uninstall.sh