End-to-End Profiling
This method enables collecting all traces in a single file while providing precise control over when trace collection starts and stops. It simplifies analysis by consolidating all profiling data into a single file. However, this can result in a larger trace file, which may be more difficult to load and analyze in browsers or tools such as Perfetto. To avoid generating large trace files, we recommend using methods included within end-to-end (E2E) profiling separately, when the full trace is not required.
E2E profiling captures all relevant data in a single run, combining:
Due to the large amount of data collected during E2E profiling, Python stack events in the PyTorch Profiler are disabled by default. If you need Python stack events, use either PyTorch profiling via asynchronous server or PyTorch profiling via script, as both methods collect these events by default.
While you can collect hardware traces, we do not recommend doing so during E2E profiling because it significantly increases the trace file size. For hardware-level profiling, see this document.
To execute E2E profiling, use one of the following procedures.
Server Profiling with a Single Request
-
Disable hardware tracing to reduce the trace size. Skip this step if you want to collect the hardware traces.
-
Enable E2E profiling.
-
Set the output directory.
-
Start the vLLM server. The following example uses the
facebook/opt-125mmodel,TP=1, and the maximum batch size of128. -
Wait until the warm-up is completed and start profiling.
-
Send requests for profiling.
-
Stop profiling.
Server Profiling with Multiple Requests
-
Disable hardware tracing to reduce the trace size. Skip this step if you want to collect the hardware traces.
-
Enable E2E profiling.
-
Set the output directory.
-
Start the vLLM server. The following example uses the
facebook/opt-125mmodel,TP=1, and the maximum batch size of128. -
Install the
datasetspackage. -
Send requests for profiling using the vLLM serving.
vllm bench serve \
        --backend vllm \
        --model "facebook/opt-125m" \
        --port 8080 \
        --dataset-name "random" --random-input-len 128 --random-output-len 4 \
        --random-range-ratio 1.0 \
        --ignore-eos \
        --profile \
        --max-concurrency "4" \
        --request-rate "inf" \
        --num-prompts 4 \
        --percentile-metrics "ttft,tpot,itl,e2el"
Script Profiling
-
Disable hardware tracing to reduce the trace size. Skip this step if you want to collect the hardware traces.
-
Enable E2E profiling.
-
Set the output directory.
-
Enable tracing in the script by instructing the LLM object to start and stop profiling.
Results
Performing E2E profiling results in generating a vllm(...).pt.trace.json.gz file that can be opened using Perfetto.
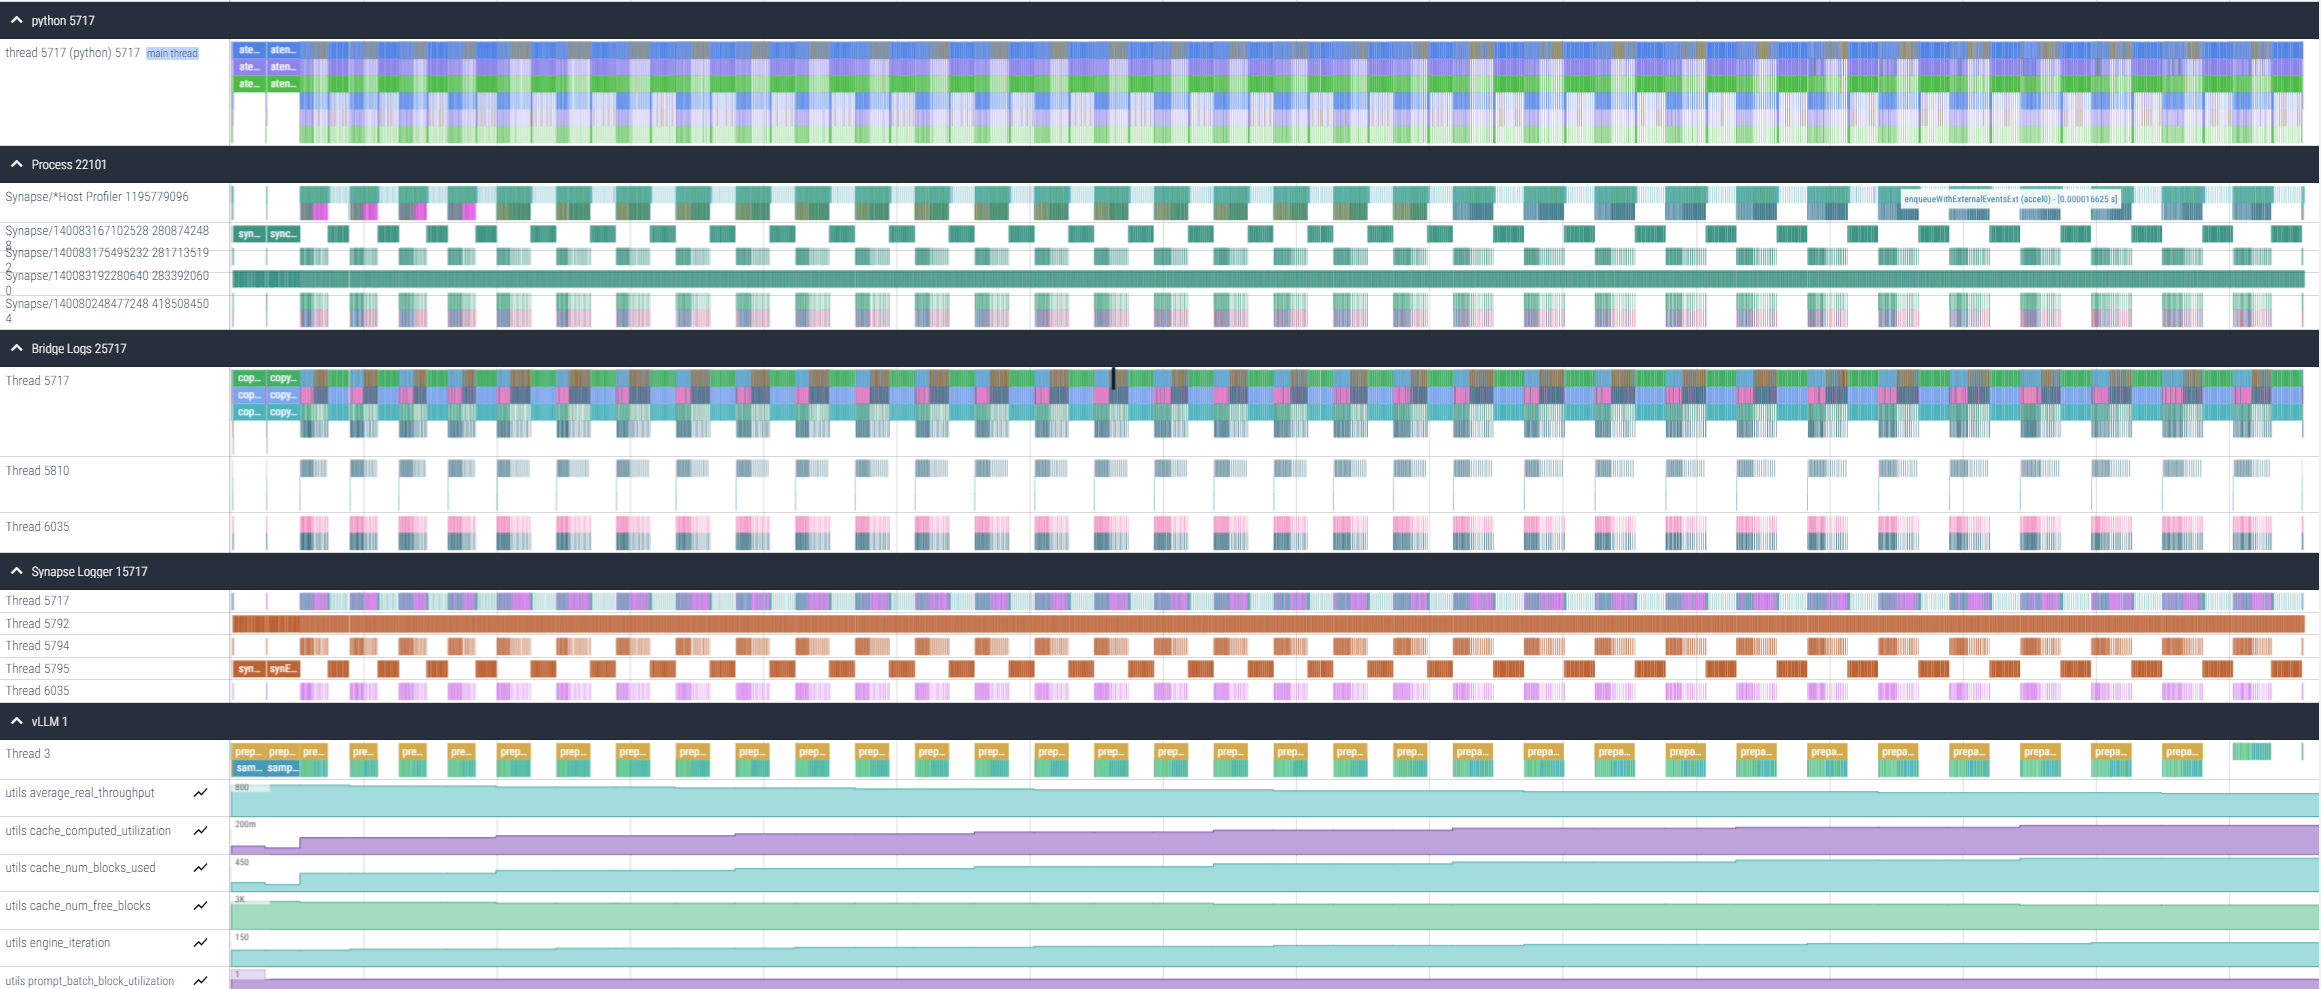
This file provides information about host gaps, prompt and decode durations, recompilation events, and python execution times.