PyTorch Profiling via Asynchronous Server
Note
This method is part of end-to-end profiling and does not need to be performed separately if end-to-end profiling has already been completed.
To profile a vLLM server using PyTorch tracing tools, use one of the following procedures.
While you can collect hardware traces, we do not recommend doing so during profiling via asynchronous server because it significantly increases the trace file size. For hardware-level profiling, see this document.
Server Profiling with a Single Request
-
Disable hardware tracing to reduce the trace size. Skip this step if you want to collect the hardware traces.
-
Set the output directory.
-
Start the vLLM server. The following example uses the
facebook/opt-125mmodel,TP=1, and the maximum batch size128. -
Wait until the warm-up is completed and start profiling.
-
Send requests for profiling.
-
Stop profiling.
Server Profiling with Multiple Requests
-
Disable hardware tracing to reduce the trace size. Skip this step if you want to collect the hardware traces.
-
Set the output directory.
-
Start the vLLM server. The following example uses the
facebook/opt-125mmodel,TP=1, and the maximum batch size128. -
Install the
datasetspackage. -
Send requests for profiling using the the vLLM serving.
vllm bench serve \
    --backend vllm \
    --model "facebook/opt-125m" \
    --port 8080 \
    --dataset-name "random" --random-input-len 128 --random-output-len 4 \
    --random-range-ratio 1.0 \
    --ignore-eos \
    --profile \
    --max-concurrency "4" \
    --request-rate "inf" \
    --num-prompts 4 \
    --percentile-metrics "ttft,tpot,itl,e2el"
Results
Performing this profiling results in generating a *.pt.trace.json.gz file that can be opened using Perfetto.
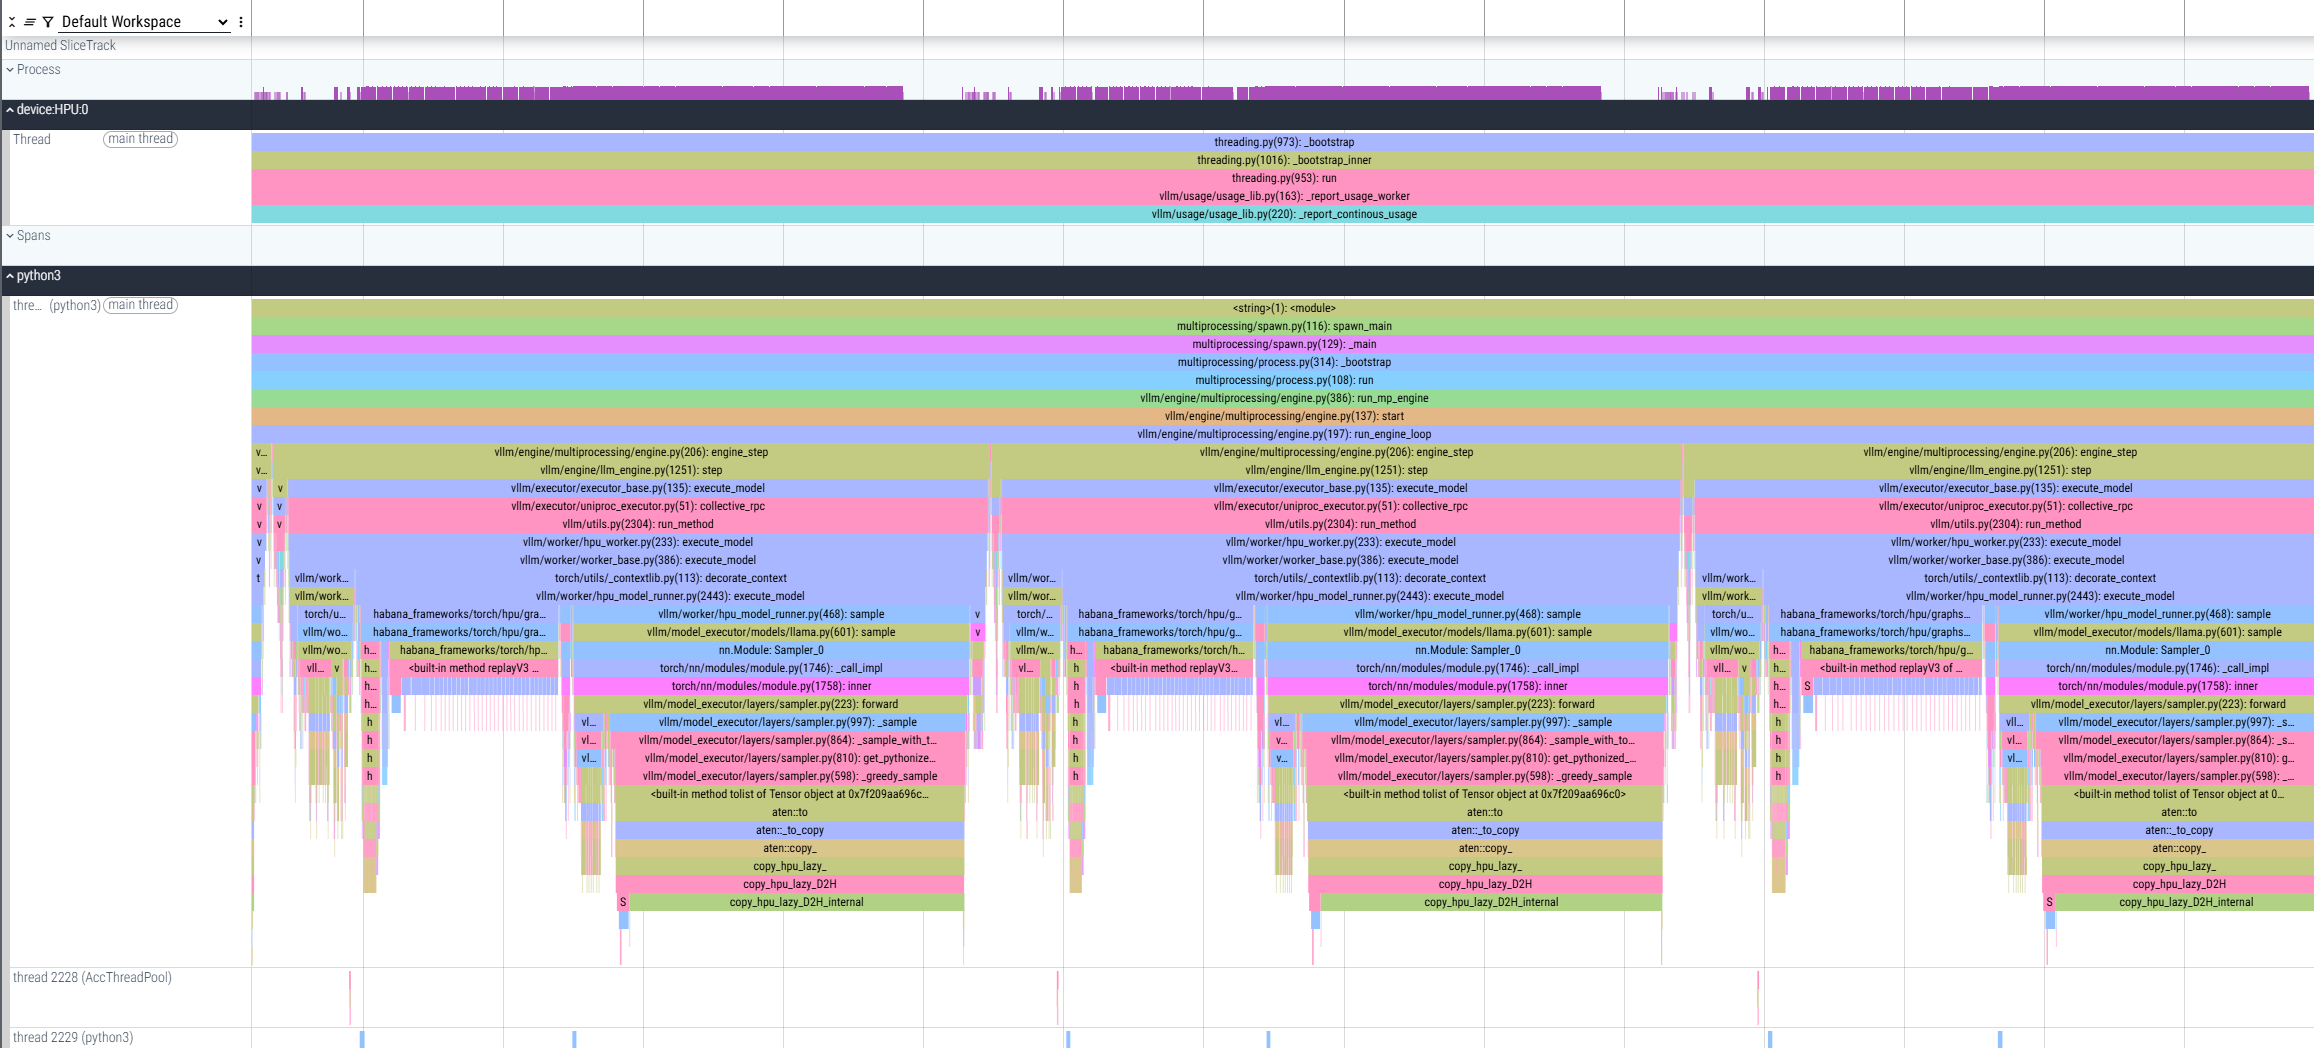
The file shows profiling of multiple prompts and decodes, where decode operations are measured, and host-side gaps between them can also be observed for analysis.