Profiling Specific Prompt or Decode Execution
This method provides basic CPU and HPU profiling information, such as timeline and duration of operations.
Executing Profiling
To execute the profiling, follow these steps:
-
Define the profiling scope using the following format:
Where:
<phase>: Phase, either prompt or decode<batch_size>: Batch size to profile<size>: Input length (for prompt) or number of blocks (for decode)-
<hpu_graph_flag>: Flag indicating whether to include the HPU graph, either t (true) or f (false)For example, profile decode with batch size 256, 2048 blocks, and HPU graphs, should have this format:
-
Run the inference command with the appropriate profiling flag, as in the following example.
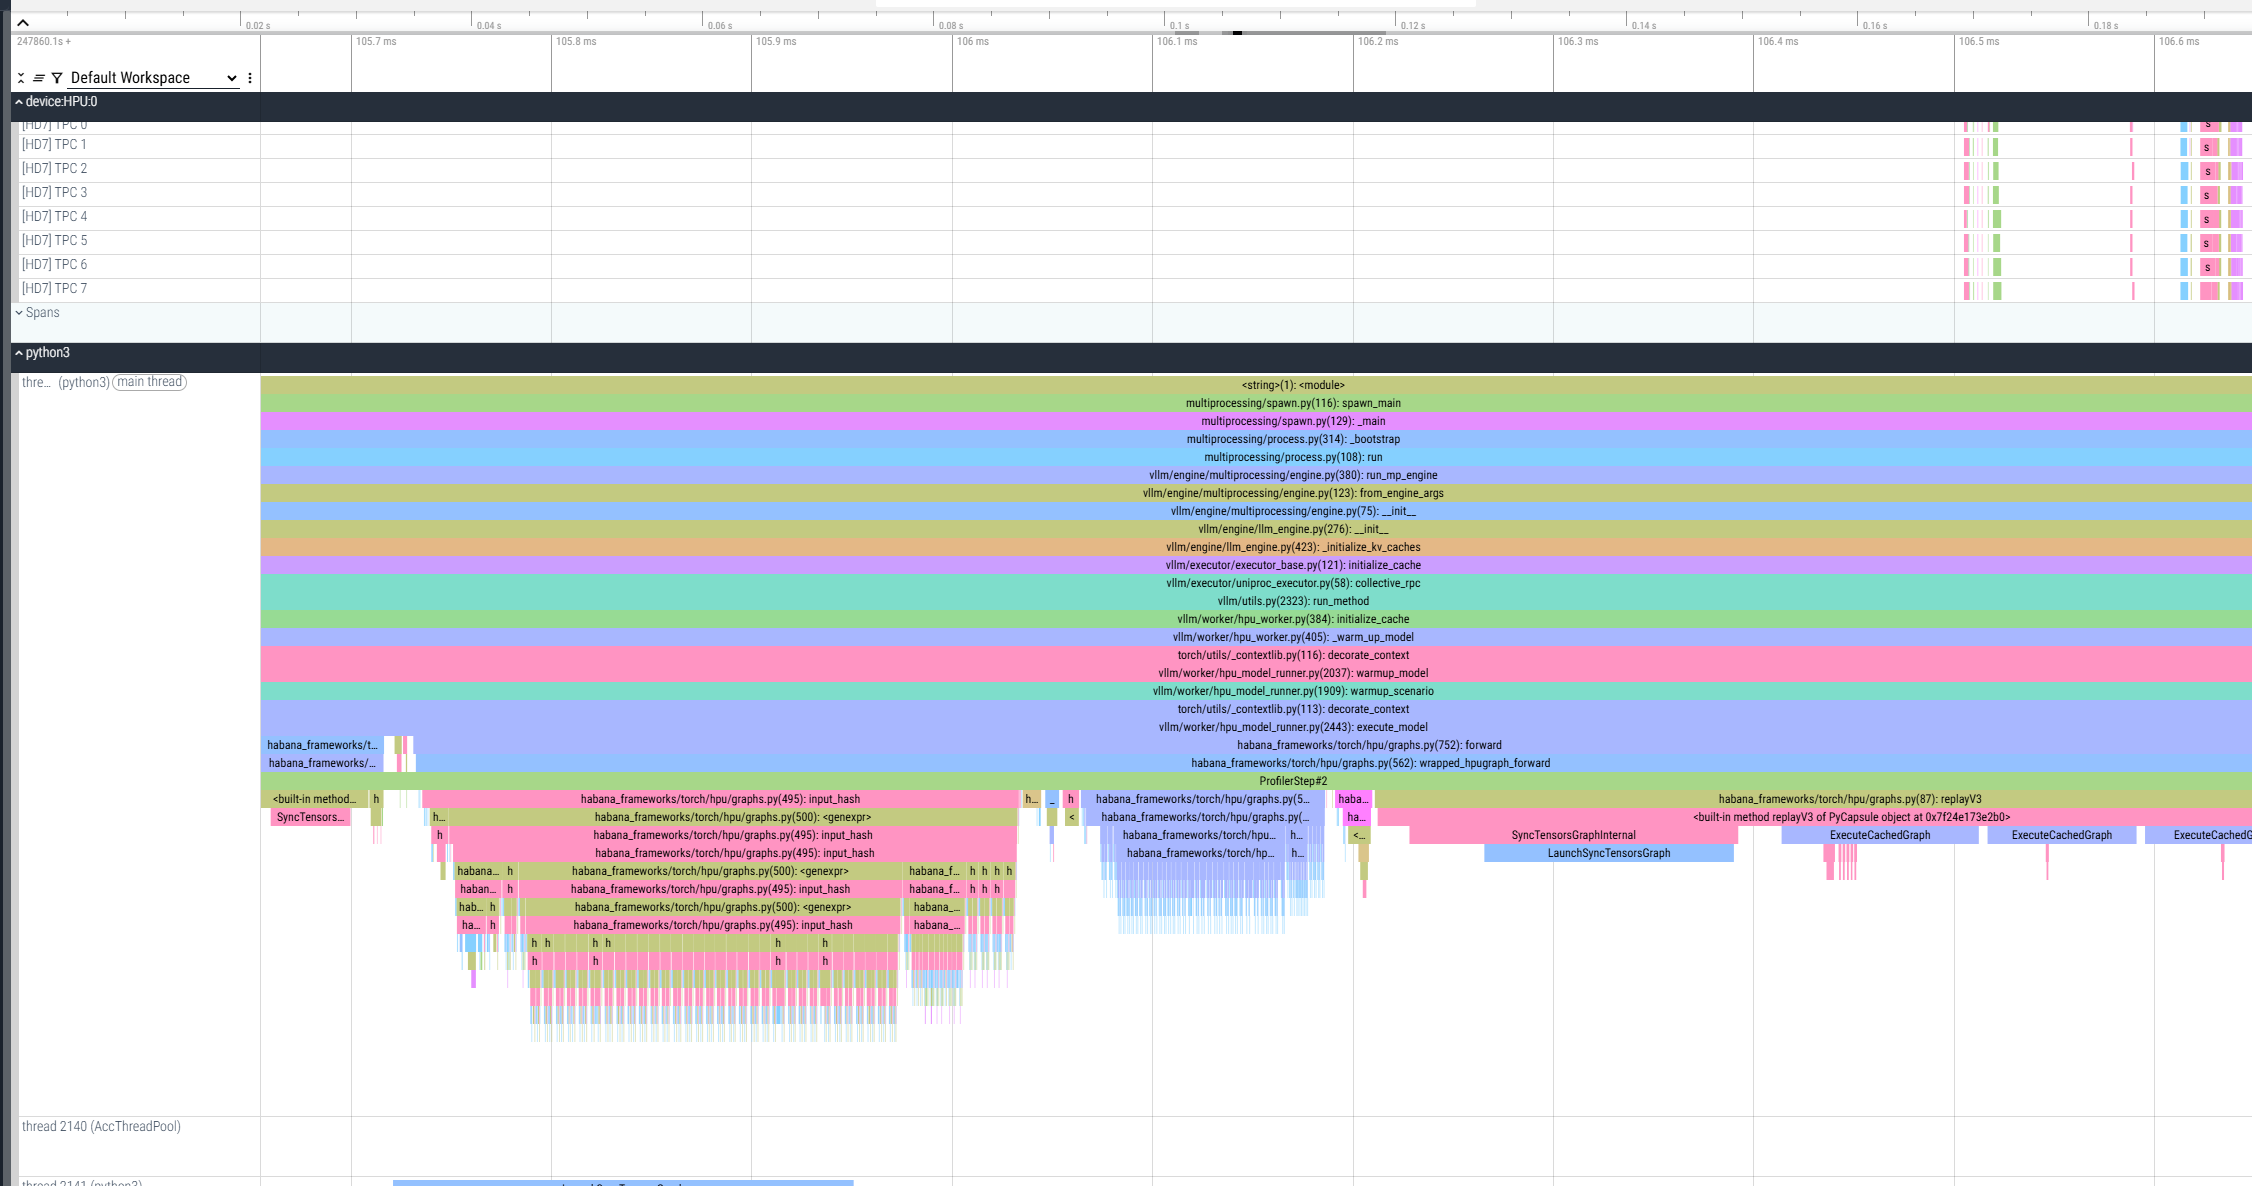
This profiling mode ends with an intentional assertion after collecting the requested trace. This is expected behavior, and the profiling data is successfully collected. As a result, a *.pt.trace.json.gz file is generated and saved in the current working directory. It can be viewed using Perfetto:
Enhancing Profiler Configuration
To gain more detailed insights into device-level behavior, such as fused graph structures, node names, and trace analyzer data, enhance the profiler configuration by following these steps:
-
Configure profiler to collect detailed traces.
-
Set the following flags.
-
Run the profiling with enhanced configuration. The following example uses decode profiling with detailed traces.
As a result, the .hltv file is generated in the current directory in addition to the *.pt.trace.json.gz file:
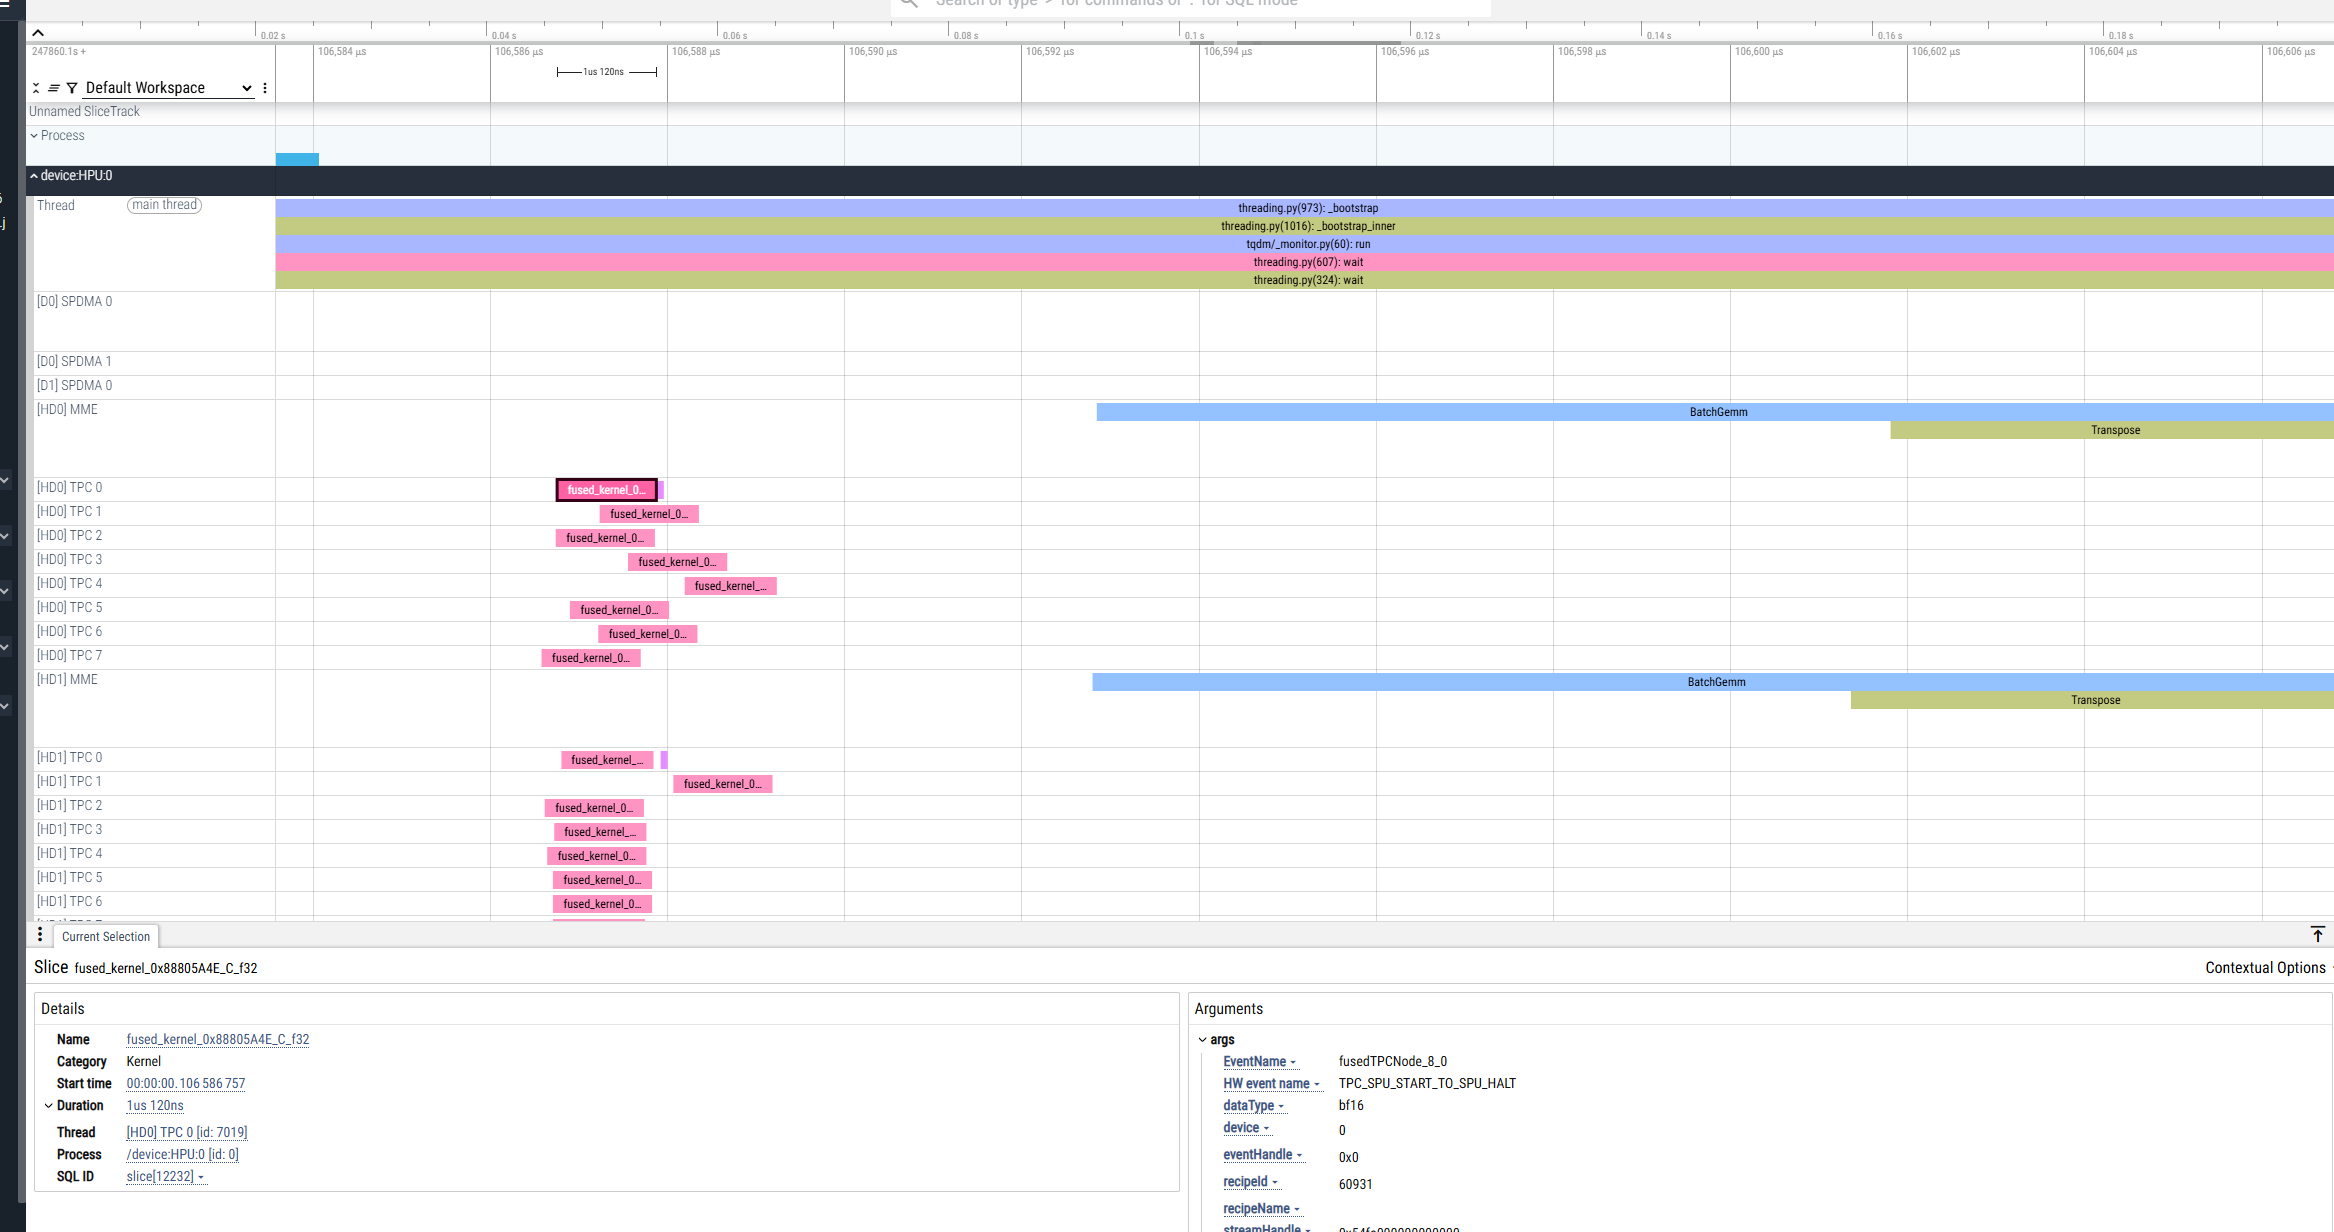
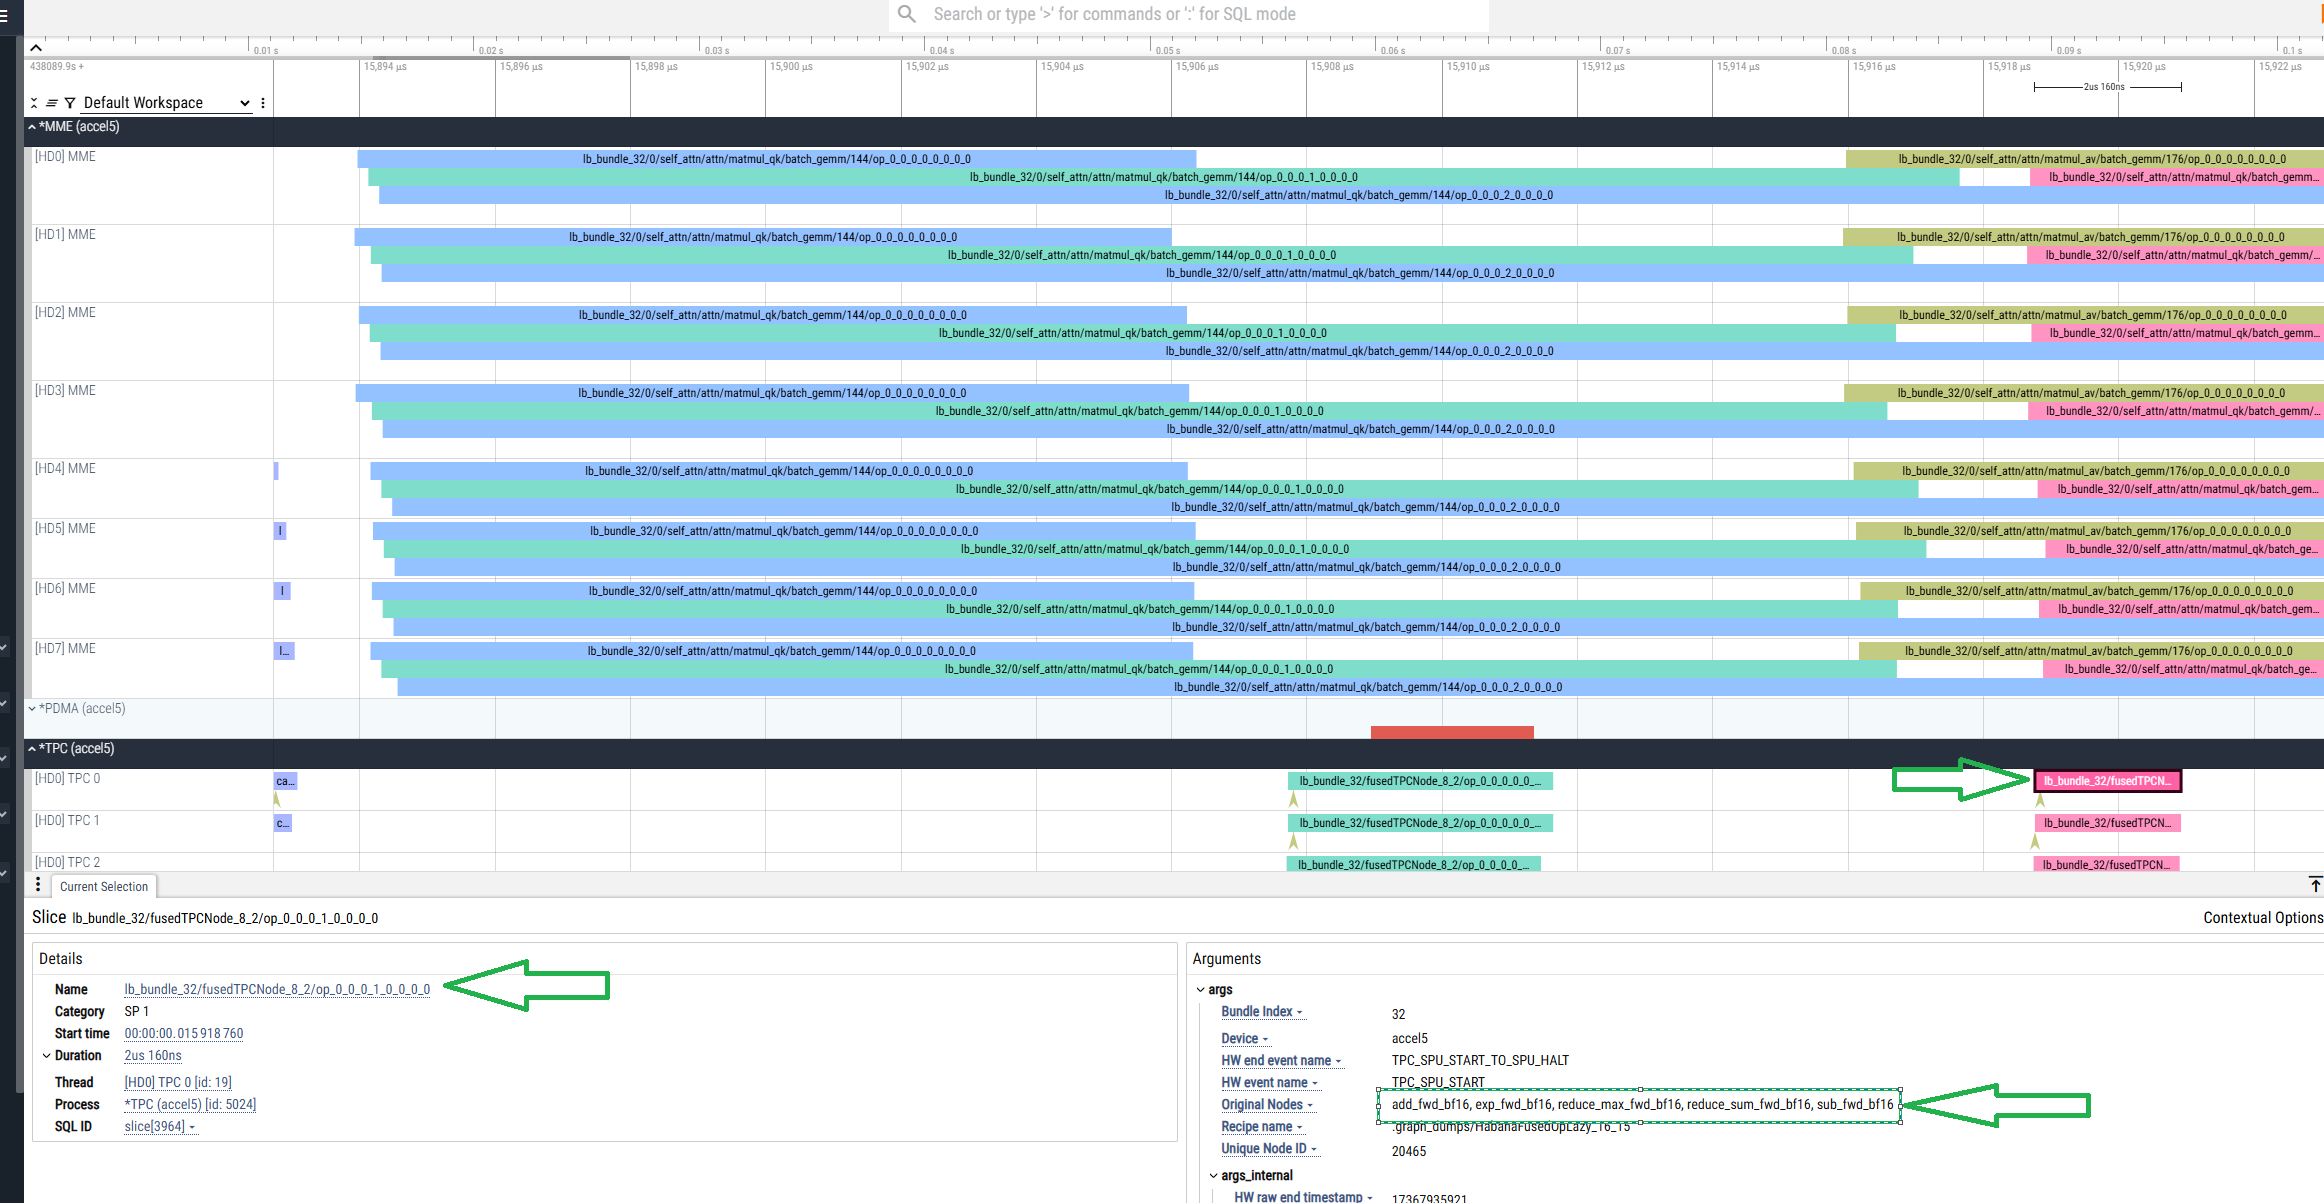
The .hltv file contains node names, graph structures, and information on what is inside each fused op.